Two annotators, one published rubric, and a ceiling on everything downstream
This screen leaves DAGM behind. DAGM's defect classes are synthetic by
construction, so there is nothing honest to argue about in them. The Virginia Tech corrosion
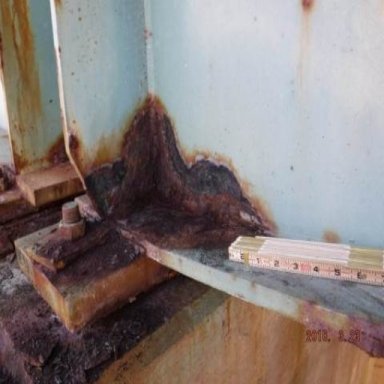
condition-state dataset is CC0 public domain, ships its own published
annotation rubric, and its four ordinal states — good, fair, poor, severe, after AASHTO and
BIRM — have boundaries that two competent people genuinely read differently.
What the two passes are, exactly. There is one published ground truth: a
per-pixel mask. Turning it into one condition state per image needs a rule, and the rubric
does not fully determine which. Pass A takes the worst state covering at least 0.5% of
the frame — the conservative, safety-first reading. Pass B takes the state covering the
largest corroded area — the representative reading. Both are defensible under the published
guidelines. Neither is two humans, and this screen does not claim they are. The images where
they differ are precisely the images where the rubric is underdetermined.
Cohen's κ, all 440 images
0.310
fair
Quadratic-weighted κ
0.397
ordinal scale, adjacent errors forgiven
Krippendorff's α
0.240
nominal, tolerates missing marks
Raw agreement
52.5%
why κ exists
This is the number that caps your model
Cohen's κ of 0.31 is “fair”.
A supervised model cannot be more consistent than the labels it is fitted to. Before anyone
argues about architectures, this is the ceiling — and it is a property of the rubric, not of
the network.
The disagreement is not random
Pass A sits on average +0.57 states above
pass B, and 100% of disagreements run
in that one direction. The two passes do not disagree at random. One systematically escalates. Cohen's kappa is low here because of a bias, not because of noise, and the fix is a rubric that says which reading is intended -- not more annotators, and not a better model.
How far apart, when they differ
Almost all the disagreement is one state wide. That is what makes the
taxonomy fixable rather than hopeless, and it is the input to screen 4. A rubric whose
disagreements were two and three states wide would be telling you something much worse.
Do it yourself — the room is the third annotator
These are the twelve most borderline images in the set, chosen by how evenly
their corroded area splits between adjacent states. Put your name in, judge them against the
published rubric, and the statistics below recompute with your pass included. Krippendorff's α
is used for the three-way figure because it tolerates the incomplete coverage a live pass
produces; Cohen's κ cannot.
precomputed The two passes, the confusion matrix and the bias figures
were derived from the published masks by scripts/build_corrosion_study.py at
2026-08-09T19:45:14+00:00.
computed just now Every κ and α in the table above is
recomputed on each request through atlas_shared.stats — the same implementation
Demo 2 uses — including any pass the room has just entered. Source: VT Corrosion Condition State, DOI 10.7294/16624663.v2, CC0 1.0.